Internet of Trash
––
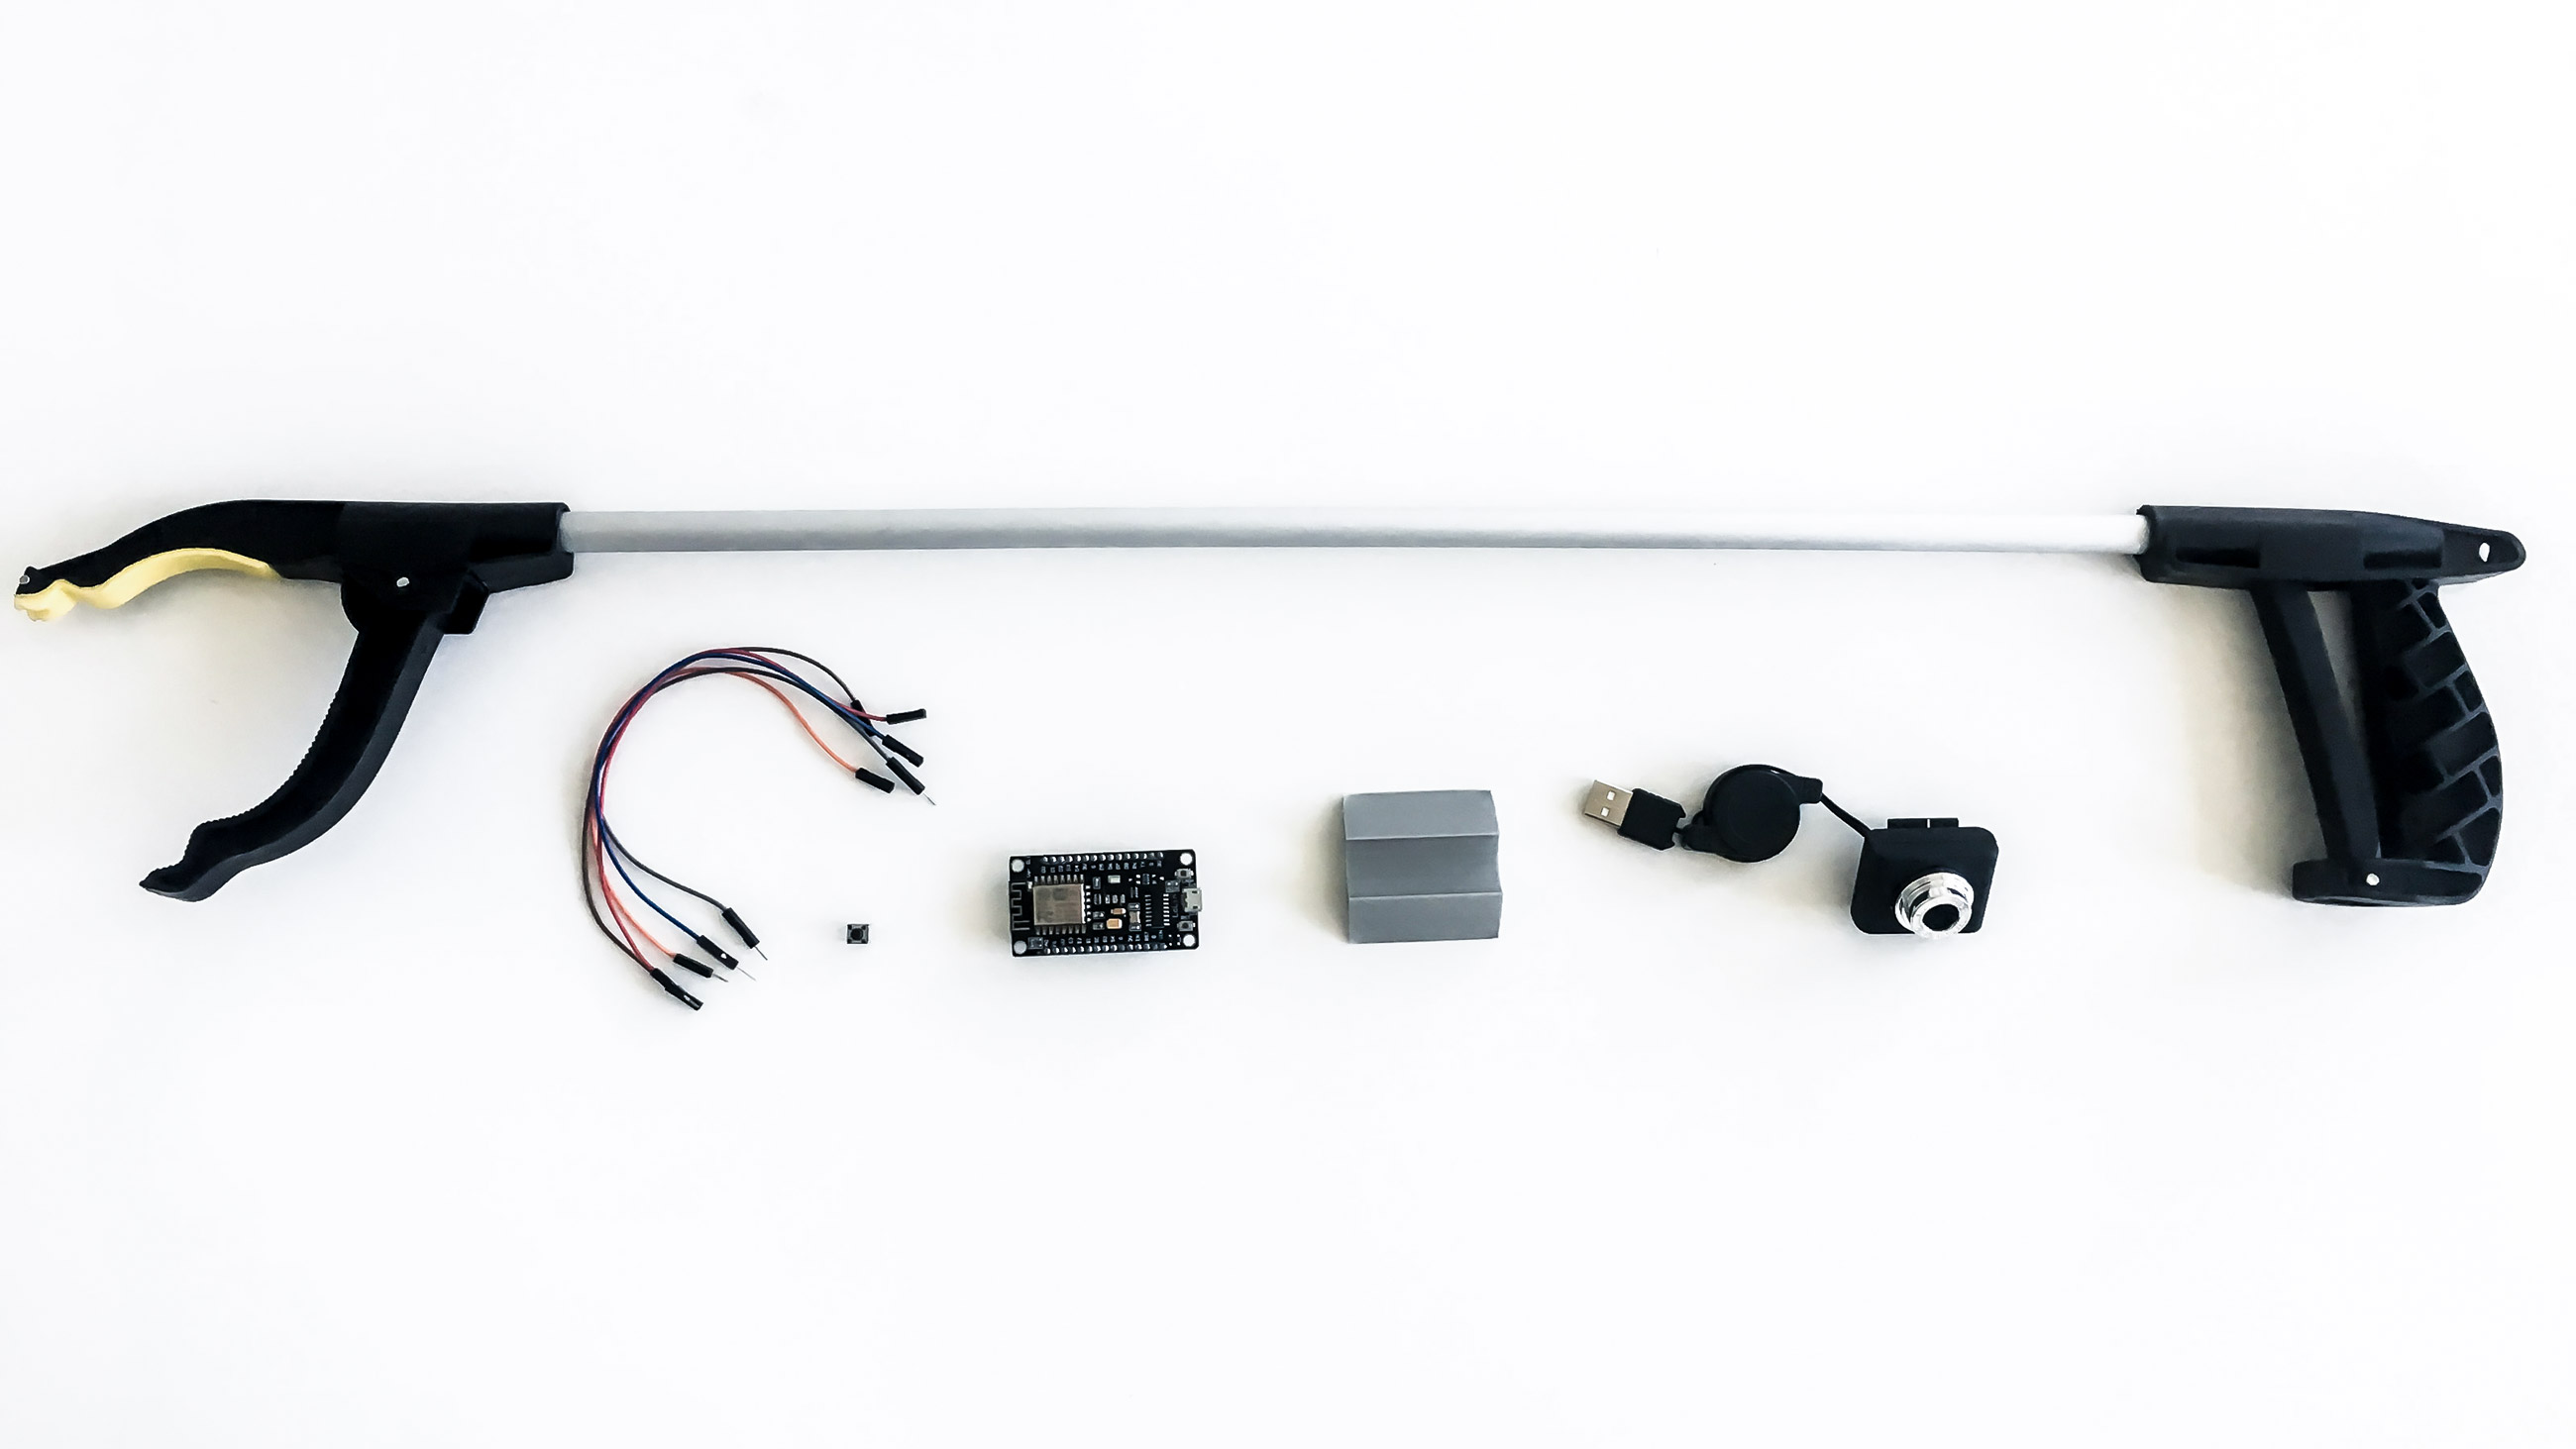
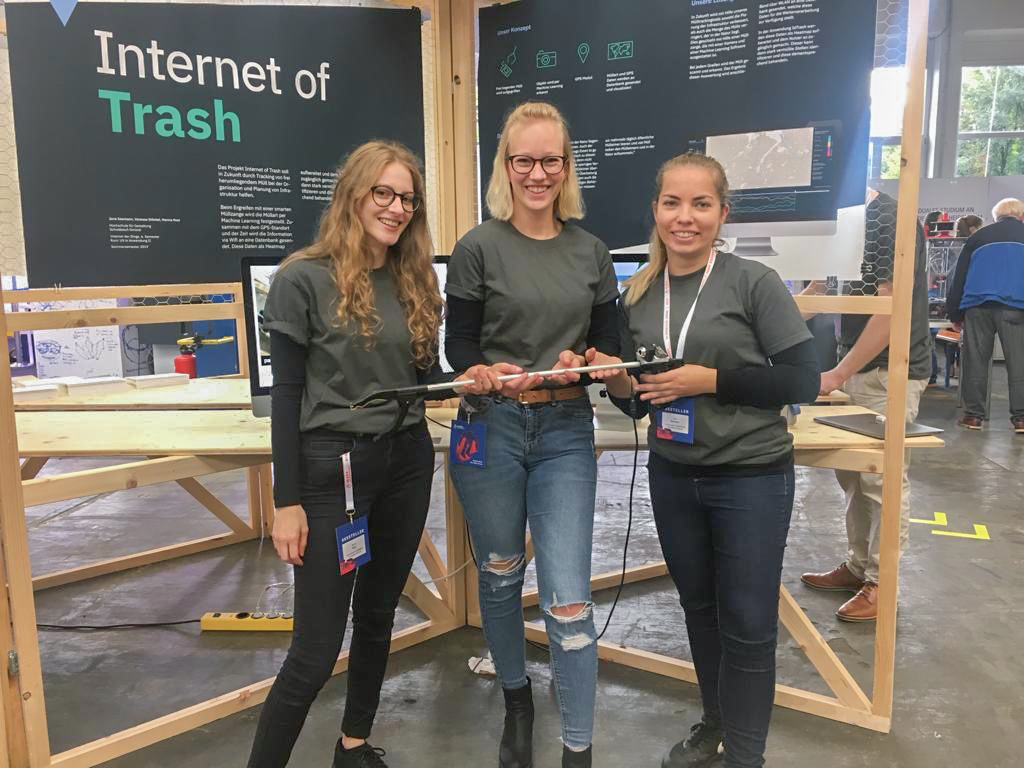
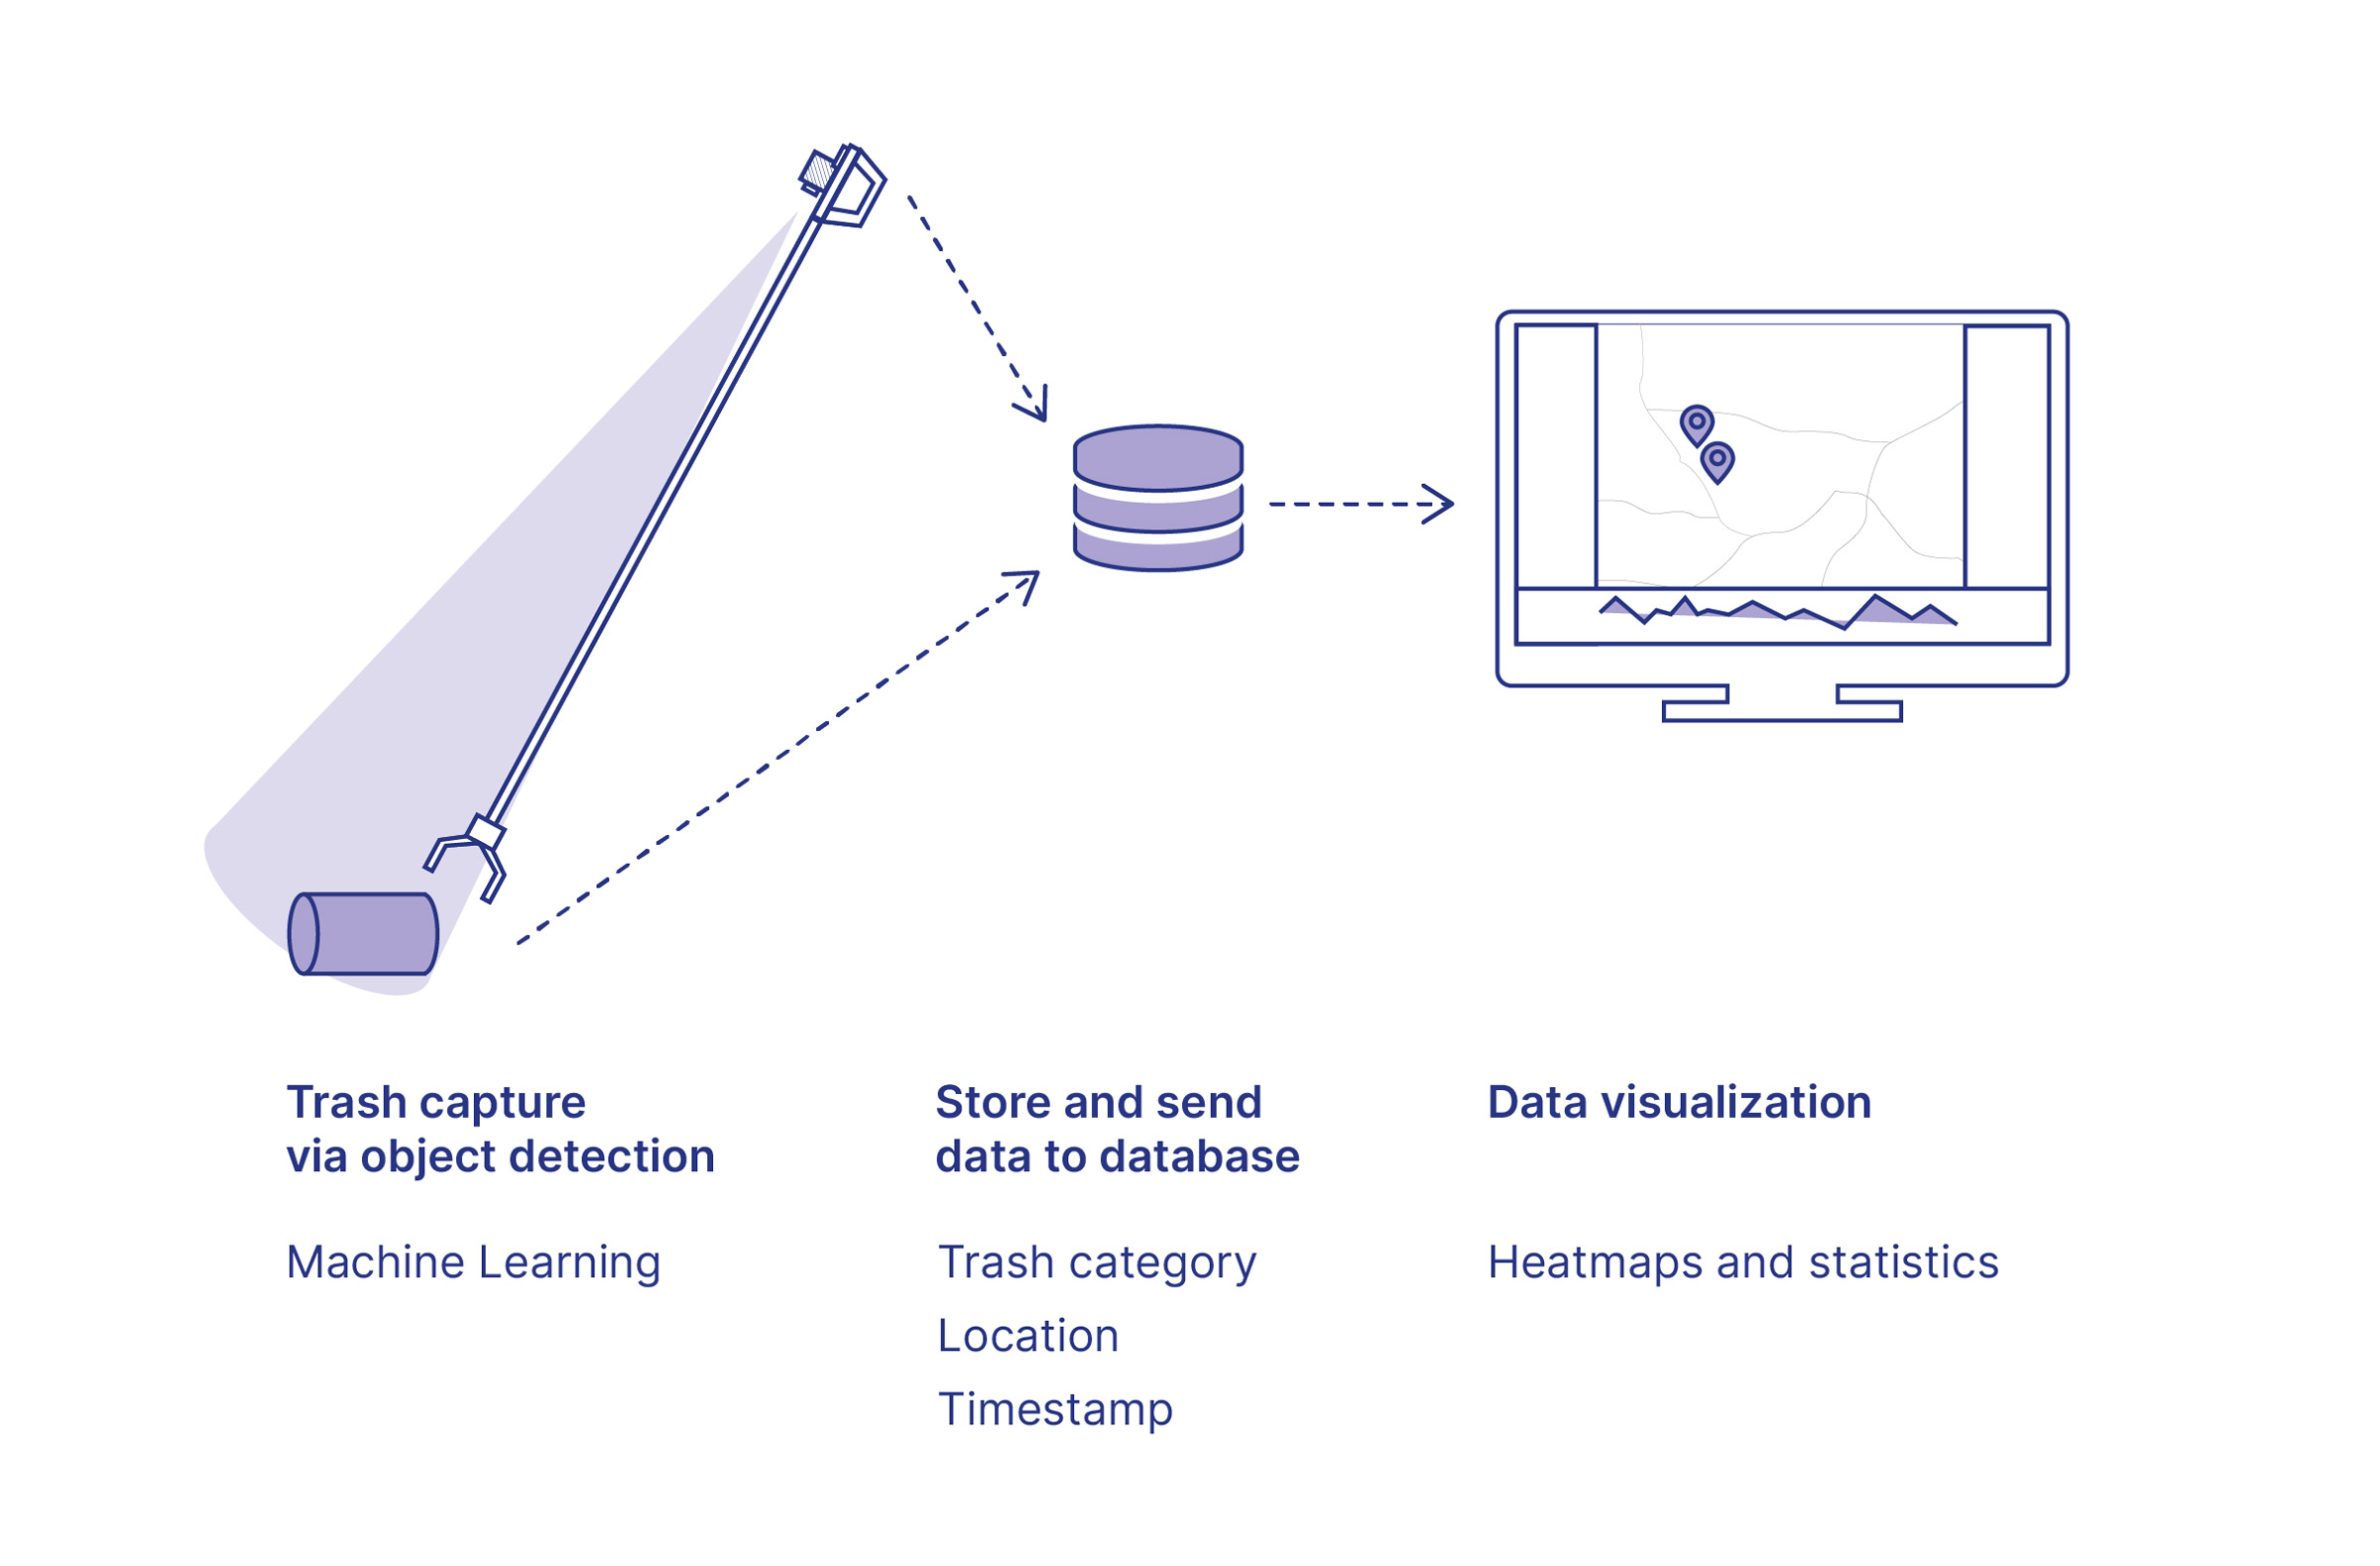
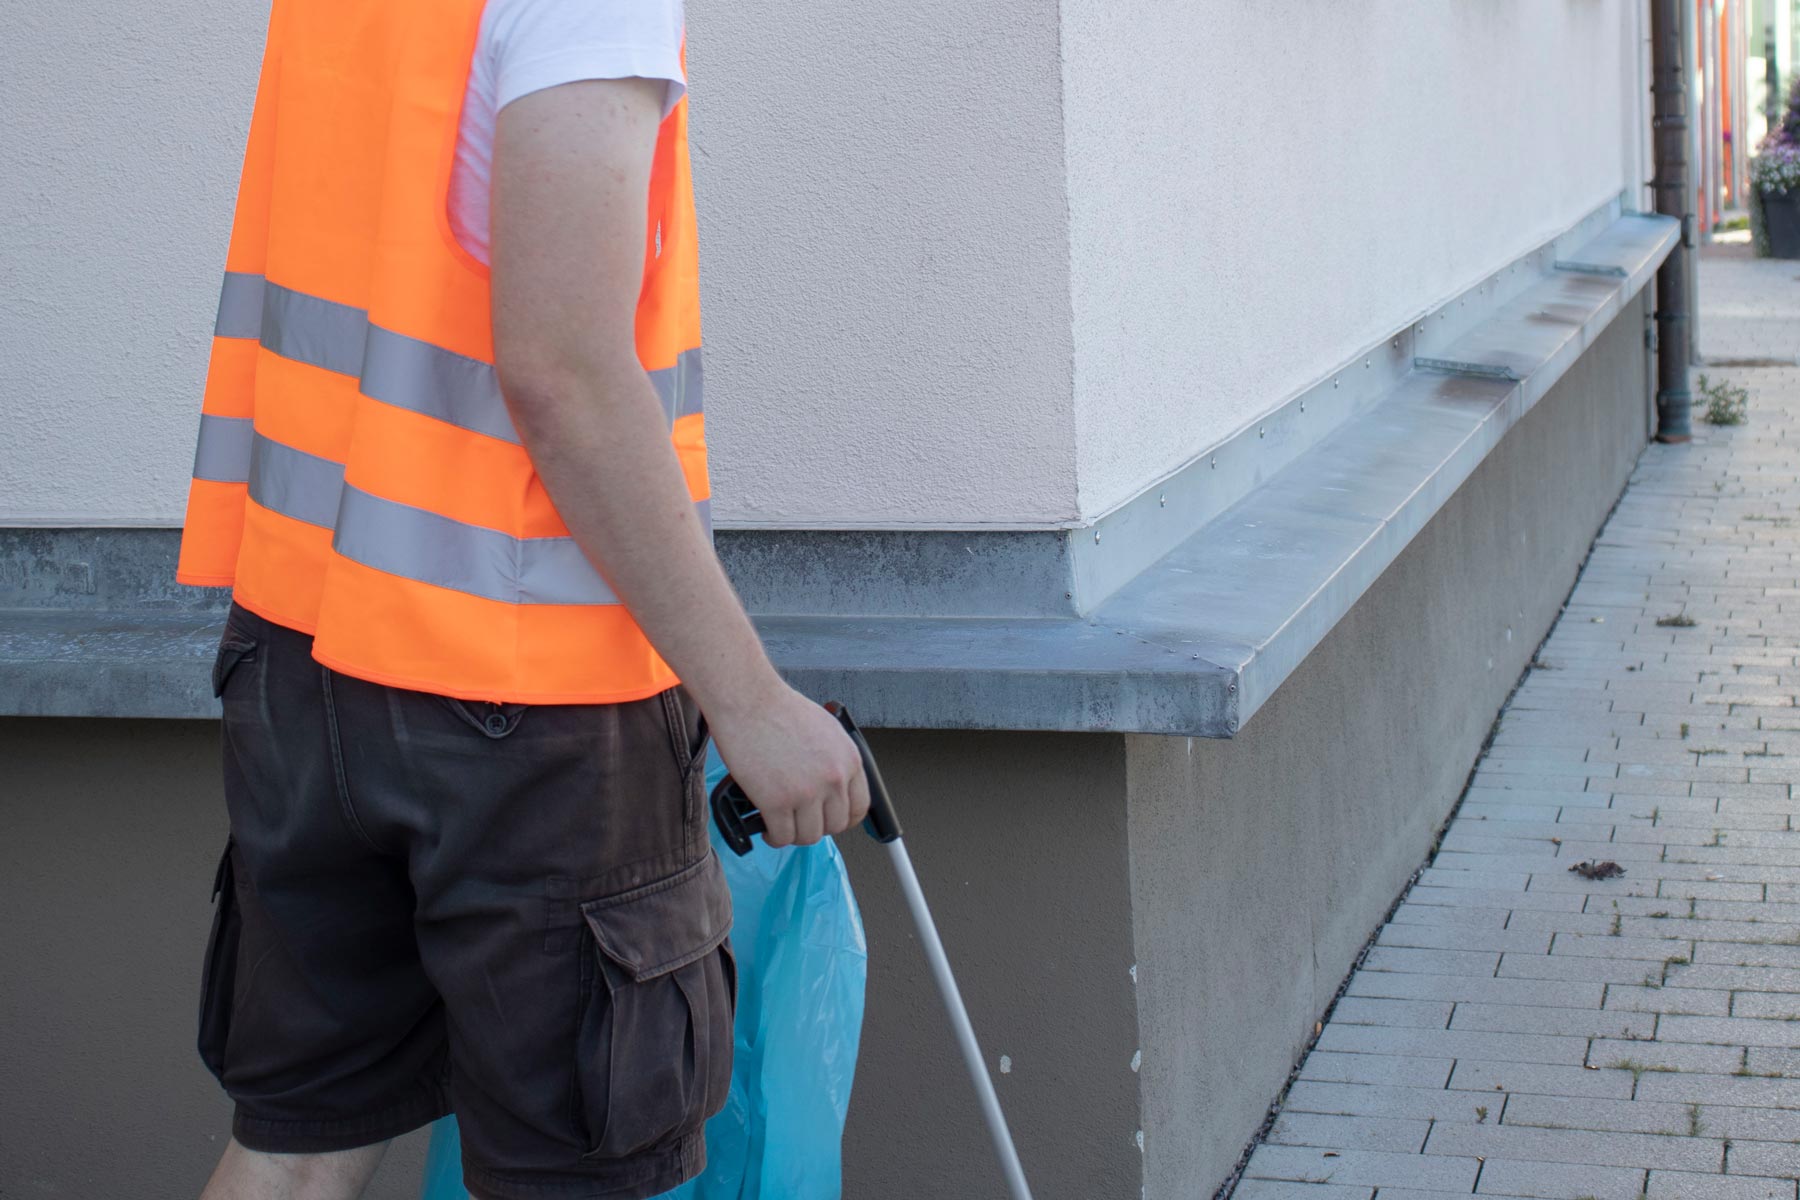
The littering of the environment is a far-reaching problem that is difficult to eliminate. Many factors lead to people carelessly throwing away their waste. With the help of our waste tracking tool, the planning of the infrastructure is improved as well as the amount of waste in nature is reduced. This is done with the help of garbage tongs, which are equipped with a camera and machine learning software. Every time a city worker grabs garbage, it is scanned and recognized.
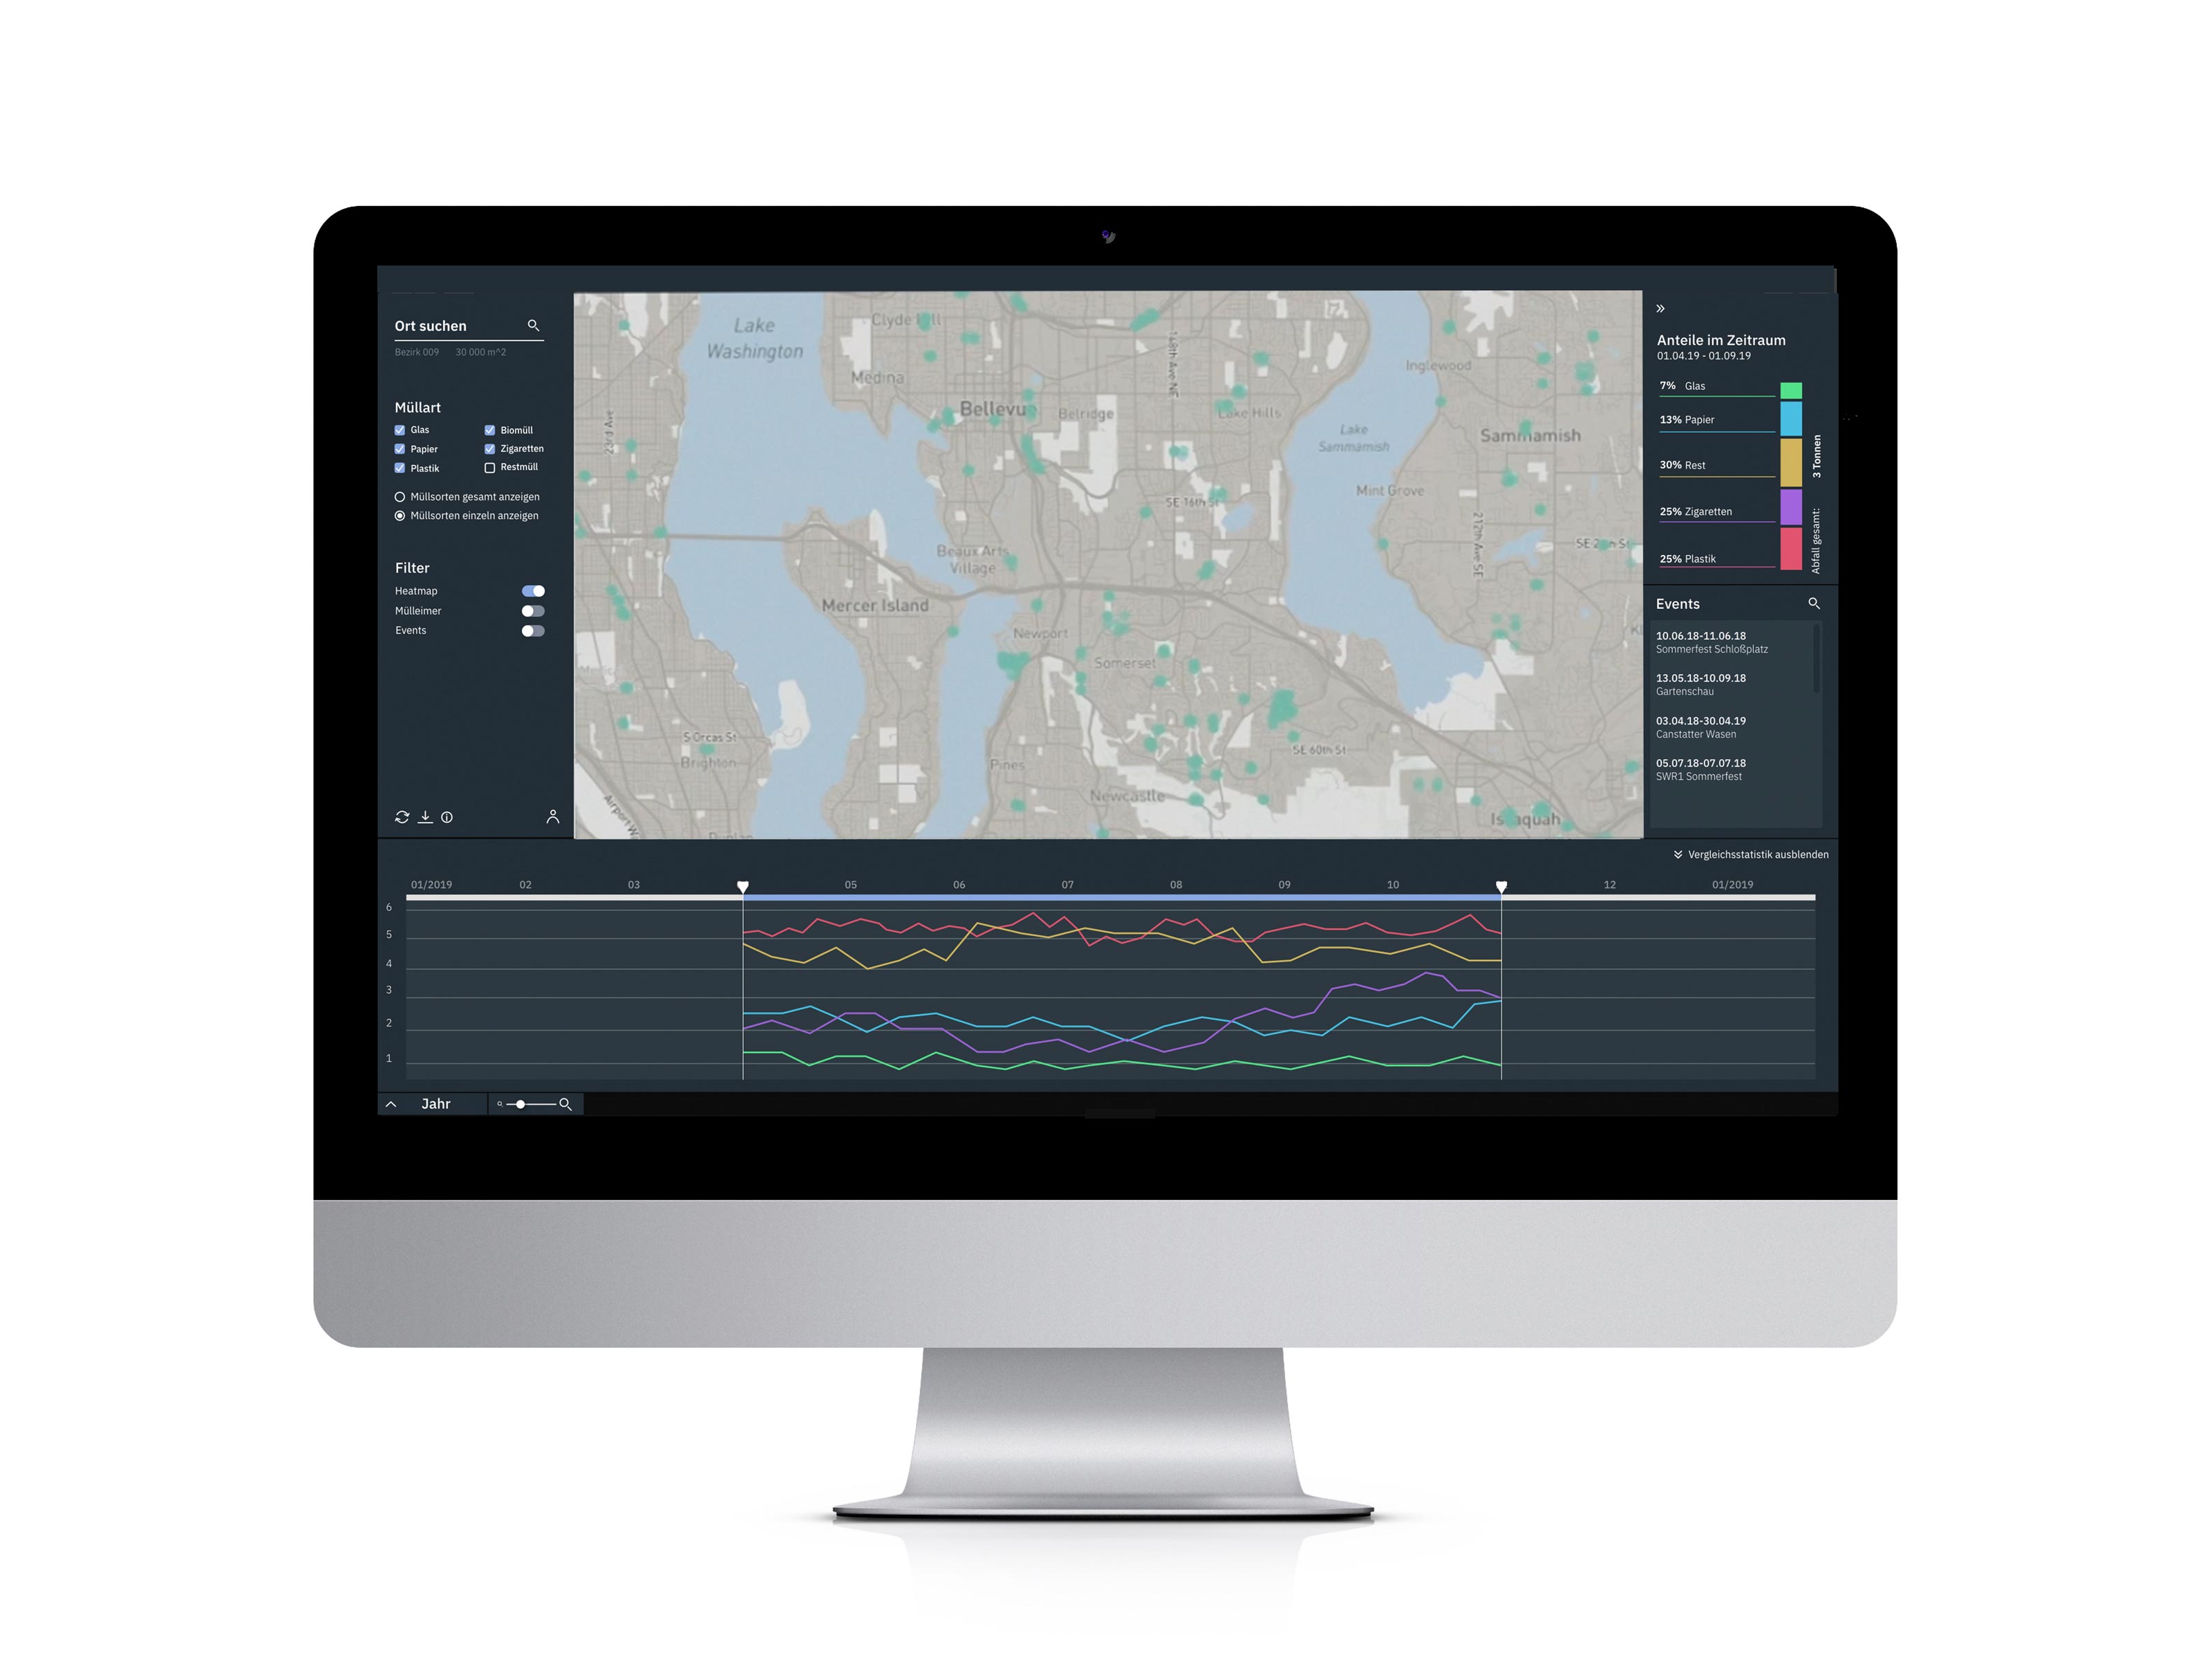
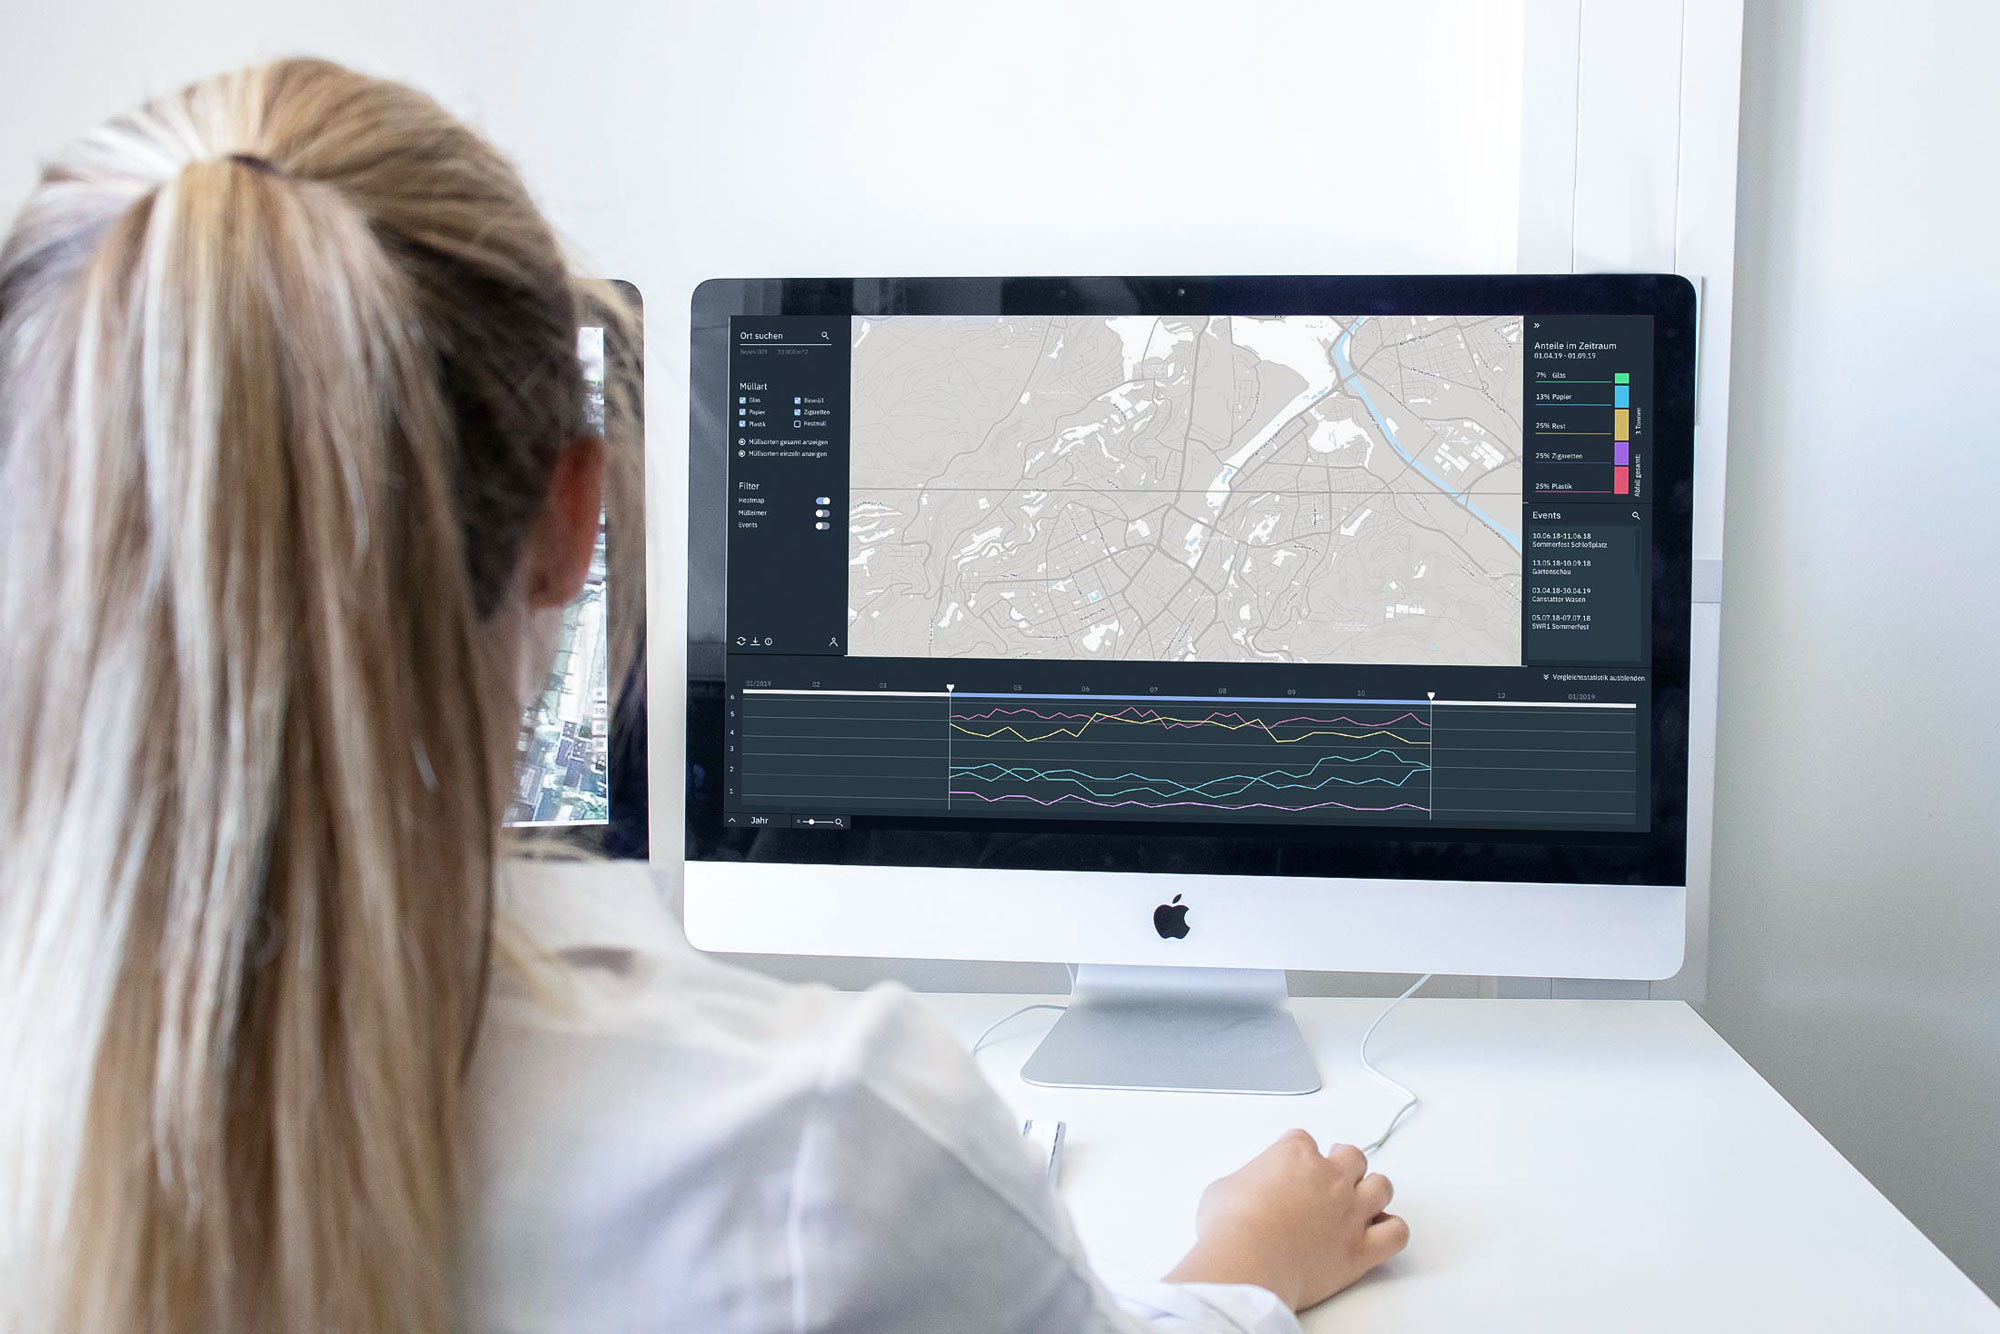
The result of this evaluation can then be sent to a database via Wi-fi, which makes the data available for further processing. In the IoTrash application, this data is presen- ted as a heat map and thus made available to the user. Users can be institutions such as the building management office, city planners or the city utilities. This enables them to identify heavily littered areas and handle them in the short and long term.
Internet of Trash Concept
The issue and our motivation
The pollution of the environment in general is a major problem for the future. Not only in the seas, but already in the cities we can observe the pollution of our environment. Many fellow citizens do not seem to be affected by this. This can be seen on the one hand in the permanently overfilled waste bins and on the other hand in the waste which lies freely in nature.
The trend to get food-to-go on the way also contributes drastically to these observations, because it is not uncommon for bulky packaging to overfill the trash cans and thus contribute to their overloading especially in larger cities. This is also confirmed by employees of the responsible authorities:
„Particularly in summer, we have to empty public waste bins several times a day and collect a large amount of rubbish far away from the bins.“
Not only because of general problems such as climate change, but also to make the city more attractive, many initiatives have already been taken to fight this. Educational events and posters, city clean-up cam- paigns for local citizens and schools, but also digital innovations such as the sensory detection of the filling level of waste bins aim to help here. These ideas help to encourage residents to think more sustainable. The waste problem is nevertheless improving only slowly. In large cities in particular, it is becoming increasingly difficult to keep track and find explanations for littering.
IoTrash User Interface
Through IoTrash's user interface, long-term planning and control of waste reduction is enabled. Other benefits, such as identifying causes of widespread waste in cities is possible, and it also serves as a support for city and event planning of short- and long-term measures. A problem that has been difficult to represent statistically becomes tangible through numbers. A comparison of waste amounts across countries and cities is possible.
